Using quality-focused analytics as an effective method to reduce errors in the laboratory
Valuable information can be obtained from the laboratory information system (LIS), but only readily available laboratory analytic reports can help labs reduce errors and improve processes that help prevent them. With the LIS producing an immense amount of data that is relevant for laboratory operations, the manual process of measuring it has become a time-consuming task, and one that is easily subject to human error. Developing reports from the information provided by the LIS has also become a struggle for many lab leaders because of time constraints and limited staff resources.
The value of a laboratory analytics system
Laboratory errors can encompass many areas and range from defects due to improper ordering of tests, to incorrect reporting and interpretation of results. In an effort to reduce these errors, laboratories are increasingly looking toward more effective solutions, including the adoption of automated laboratory analytics platforms. Laboratory analytics are proving to be a beneficial tool in ensuring that large amounts of data can be analyzed and presented in meaningful reports that easily identify opportunities to catch and correct laboratory errors.
Without access to key data in the laboratory, it is virtually impossible to appropriately benchmark and measure quality and efficiency in an effective way. A laboratory analytics system is needed to provide metrics to keep teams focused on improving performance, productivity, quality, and patient care. Instead of relying on limited information from the LIS, which often still requires manual report writers, a laboratory analytics system extracts data from the LIS and generates a range of reports that identify key quality metrics. The system can include detailed reporting in areas focused on improving quality, so lab leaders have immediate access to hundreds of reports in a timely manner. This access to important information ensures that a performance problem never goes undetected and keeps quality managers and lab directors aware of the source of any laboratory problems in all phases of lab testing.
Maintaining low error rates in the analytical phase
While most errors in the laboratory are attributed to either pre-analytical factors (test ordering, specimen collection / labeling) and post-analytical factors (result reporting, interpretation, delayed results, and critical call management), metric errors in the analytical phase occur, and they are not commonly monitored on an ongoing basis. In recent years, the number of laboratory errors in the analytical phase has decreased due to improved automated instrumentation and the automation of manual processes. Laboratories are also making use of external QA programs to assess the quality of testing results, such as proficiency testing.1 However, with the use of a quality analytics software program, laboratory directors, managers, and supervisors can also maintain minimal rates of errors by evaluating laboratory reference ranges easily.
Some questions that should be considered include:
- Can you easily easily identify and evaluate a normal patient population?
- How easy is it to acquire sufficient numbers of data points for the appropriate population?
- Are you evaluating gender and age when necessary?
- Have your normal ranges shifted due to recent implementation of new lab testing equipment or reagent methodology change?
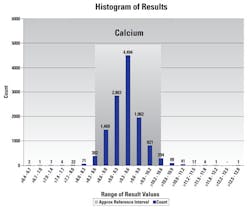
Quality analytic reports like the one seen in Figure 1 become beneficial when evaluating patient populations or picking up on normal range shifts when new instruments are validated in the laboratory. For example, management can determine if calcium’s shifted after the reagent is validated using another method or change in reagent generation or lot number.
Using analytics to optimize quality
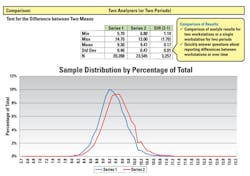
The ability to identify errors concerning reporting differences between instruments /workstations of the same methods over time allows the laboratory to monitor the quality of its lab results through the analytic testing phase. By comparing the results for multiple analyzers using standard statistical methods to measure difference of means as seen on Figure 2, the laboratory can determine if the analyzers of the same methodology using the same reagents are compared to each other and a large significant difference is not seen. This is useful for comparing lot changes, new methods, or comparisons every six months as required by accrediting lab compliance agencies.
By adopting an automated laboratory analytics platform, laboratory management teams can evaluate data in a way that helps them adopt metrics that capture errors, delivering actionable information to monitor and improve QA processes. Furthermore, automatic analytics provide readily available data that can be easily viewed to trace root cause analysis and identify problems that were not seen before. If the data that is captured is measured, then it can be improved. Daily management with a laboratory analytics system and an engaged leadership team are essential components in monitoring quality assurance and reducing lab errors. When laboratory data is managed daily, dramatic improvements can be made, resulting in decreased lab errors, improved specimen quality, and better patient safety.
REFERENCE
- Agarwal M. Quality-improvement measures as effective ways of preventing laboratory errors. Lab Med. 2015;45(3) e80-e88. https://doi.org/10.1309/LMD0YIFPTOWZONAD.
Tim Bickley, MT(ASCP), MBA, CPHIMS, serves as Vice President of Sales for Ann Arbor, Michigan-based Visiun, Inc.
Vanessa Hawrylak, MS, MT(ASCP), serves as Technical Support Specialist, for Visiun.
Kristina Ziaugra serves as Marketing Manager for Visiun.


