In last month’s column we covered the basics of traditional PCR and how in the presence of a template bearing the correct, primer-defined target sequences this method would generate large numbers of replicate copies of this amplicon. Thus, by carrying out a specific and sensitive PCR on a controlled template material, we can assess whether the defined target sequence was present (amplicon is produced) or absent (amplicon is not produced). The utility of this in applications such as pathogen detection is immediately obvious, and by carefully adjusting our meaning of “specific,” we can take this simple present/absent answer and apply it to things such as single nucleotide polymorphism (SNP) genotyping. In still other applications such as variable nucleotide tandem repeat (VNTR) typing, while all relevant templates would be equally expected to produce a product, individual specific variations in spacing between the primer sites lead to differences in amplicon length between individually derived genomic specimens; combining sufficient numbers of these can be enough to uniquely identify an individual genetic “fingerprint.” These applications and more all have something in common: they require a means to detect and characterize the presence of PCR products after the end of the reaction. These methods are collectively known as “endpoint PCR detection” and will be the focus of this month’s column.
The first method we’ll consider is one which is old, but simple, inexpensive, and effective, and now frequently done at some point in most undergraduate life science degrees—agarose gel electrophoresis. The approach is simple. Agarose is a complex carbohydrate, or long branching chain of sugar molecules, roughly similar in structure to the carbohydrates found in substances such as edible gelatine used in making flavored desserts. That analogy is important, because essentially agarose gel electrophoresis starts the same way; the agarose is mixed into an aqueous solution and heated to melt, then poured into a mold to cool and form like a gelatine dessert. Some critical differences, however, are that unlike edible treats, for this application the aqueous solution is salty (making it a good electrical conductor); it’s buffered to a weakly alkaline pH, about 8; and, unlike food gelatines, agarose comes purified in molecules of a narrow range of sizes and degrees of branching. This regularity means that after casting and hardening, our “salty gelatine” has a very uniform pore size, or size of the open gaps in its macromolecular structure. Finally, agarose gels are for most purposes cast in the shape of flat, thin slabs, and have a number of small pockets or “wells” cast into the mold near one end of the slab.
The cast agarose gel is placed in a tank full of the same buffer used to melt the agarose (this is done to avoid osmotic gradients between the gel and the buffer, which would interfere with what we’re about to do). Next we pipette a portion of our endpoint PCR product to examine into one of the wells in the gel. Usually, we mix the PCR product with a loading buffer, something like glycerol or ficoll, to make the sample dense so it easily drops to the bottom of the buffer-filled well. Generally this will also contain one or more negatively charged, large molecule dyes like bromophenol blue or xylene cyanol, which will help us see the sample as we load it in the well, and serve as a tracking dye.
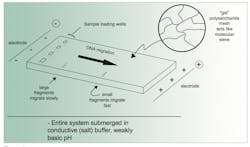
Now we apply a DC electric charge to the tank containing our buffer-submerged, sample loaded agarose gel. Critically, we need to put the negative electrode toward the well-containing end of the gel, and the positive electrode at the far end (Figure 1). Let’s think about what happens now.
- The buffer is salty. This makes it electrically conductive, meaning molecules in the tank (and gel) are subjected to a current flow between the electrodes; hence, “electrophoresis.”
- The buffer is weakly basic. Recall our fundamental DNA structure, and in particular the phosphates of the sugar-phosphate backbone. Because of the weakly basic environment, these phosphates tend to now act like acids, losing H+ ions into solution. Critically, this makes the DNA molecules weakly negatively charged, and thus attracted toward the positive tank electrode.
- The DNA molecules want to move toward the positive end of the gel, but they have to move through the uniform pore size gel matrix. This acts like a sieve; small (short) dsDNA molecules can fit pretty easily through the pores and move fairly quickly toward the positive gel end. Larger (longer) dsDNA molecules have a harder time squeezing through the pores and move more slowly. Because of the uniformity of the pore size, dsDNA molecules all of one size—such as a particular PCR amplicon—travel together, or “bunch up” in a relatively tight band in the gel matrix. (Note the restriction to dsDNA; this is because ssDNA can fold up in random shapes, so there’s no reliable relationship between length of an ssDNA molecule and its hydrodynamic properties.)
- If the loading buffer dye(s) are also negatively charged, they too will move through the gel toward the positive electrode at a rate related to their size compared to the gel pores. For a fixed agarose percentage gel, different dyes move at speeds similar to particular DNA lengths. This enables the user to monitor the electrophoresis by eye, and stop the process before DNAs of a desired size have run out of the gel.
How does this help us determine whether our PCR reaction contained an expected amplicon of a certain size? Well, the process has separated all the dsDNA in the reaction tube according to size, and it has concentrated products of a single size into bands. The missing piece of the puzzle is that we add a dye to the agarose gel (either before or after electrophoresis). This dye binds to dsDNA and upon doing so gains (or greatly increases) its ability to fluoresce. Dyes commonly used include ethidium bromide, Sybr Green, Gel Red, and their derivatives. Now, if we place the gel slab on a transilluminator and illuminate it with light tuned to the excitation frequency of the dye, the DNA bands will glow brightly in the gel and can be seen by eye as clear, distinct lines.
One final thing we’d have done if we were clever—when we loaded the gel, we’d have put in a known mixture of dsDNA size standards in one well, or a DNA ladder. By comparing our sample bands against these known size bands, we can estimate the size of any products in our test sample (Figure 2).
This method provides us with two independent pieces of data on our reaction. First, whether amplification of something occurred in our PCR reaction (as evidenced by the appearance of a band or bands) can be assessed. Second, if we know what the expected product size of our reaction is, we can also compare that with our observed results; bands of the right size help assure us the reaction has amplified the intended target. Conversely, if bands are observed but of unexpected sizes, we are probably seeing a PCR reaction with poor specificity, and cannot assume the products’ form relate to the intended target. Thus, both presence and size of product contribute to our interpretational certainty of this detection method. For applications such as VNTR, detailed determination of the size from among a set of possible sizes adds additional template-specific information which can be recovered—although, as a rule of thumb, sizes are at best ±10% as judged by this method.
If the reader is puzzled at this point as to why we can see the positive PCR product band, yet don’t see the input DNA template in our gel, please recall that PCR is an amplifying process and that there are vast numbers of identical-sized molecules making up the visible band. By contrast, the starting template is at very low numbers, and likely a mixture of different molecules, none of which can concentrate enough within the gel to lead to a visible signal.
Agarose gel electrophoresis as described here is simple, cheap, and effective, and it remains a useful tool in research and teaching labs, but it is a poor method now rarely used in clinical lab settings. The reasons for this are partly lack of speed (it’s not very fast) and difficulty to scale up and automate, but much more so the fact that it inherently results in spreading PCR products (amplicon) all over the lab in minute quantities. They diffuse into the running buffer, which drips on the table, gets spotted on a lab coat, and so forth. Unfortunately, the very strength of the PCR method is that even tiny amounts of amplicon can be detected in a subsequent reaction; thus amplicon contamination is a very real risk and can lead to false positive clinical results. Precautions such as having physically separated areas for gel analysis of PCR products from sample preparation or PCR setup, unidirectional process flows, dedicated clothing for gel handling, negative air pressure containment, and others can all help to reduce the risk of this, but it remains a very real threat which reduces the utility of this method in routine clinical use.
There are other methods for endpoint PCR product detection. One is array-based methodology, which we’ll cover in some detail in an upcoming installment of The Primer. Another is the Line Probe Assay (LPA), which looks and behaves in a similar way to the rapid immunoassay that is probably familiar to most readers. In this approach, the PCR product is labeled during synthesis by some hapten molecule (usually by having the primers themselves synthetically labeled). The similarity to a rapid immunoassay then arises because the labeled PCR product is in fact detected by what is a rapid immunoassay directed against the hapten. Usually, these allow the PCR reaction to diffuse across a paper or similar matrix test strip, which is spotted or coated with antibodies to the hapten at specific places. PCR product binds here, and a secondary immunoreaction is used to dye and visualize the immobilized label molecules. Inexpensive and fast, these methods can only test for the presence of amplicon and may thus be misled by nonspecific products inways that gel methods—which also allow size determination—are not.
What about non-PCR amplification methods? While we have not covered these so far in this series, and due to space constraints won’t have much time to devote to them, there are a few non-PCR based methods for amplification of a DNA or RNA defined sequence. Similar to PCR, these rely on amplified fragment detection as evidence for target sequence presence in the starting sample. Examples of these methods include Nucleic Acid Sequence Based Amplification (NASBA) for RNA and Helicase Dependent Amplification (HDA) for DNA. The detection methods covered here are agnostic as to source of the nucleic acid fragment (amplicon) detected and thus may be found in conjunction with these and other approaches for production of the fragment, with similar information and results obtained from the detection methods as I have described.


