While much of molecular diagnostics is focused on the examination of DNA, an increasingly important subset of tests instead examine RNA in samples. An obvious case is in the detection of RNA viruses. Recently, as well, there has been increased interest in detecting RNA transcripts from DNA-based pathogens (bacterial or viral), on the assumption that this can improve sensitivity (a single DNA gene may be transcribed many times, thereby creating a more abundant target and improving assay limits of detection) or to provide more meaningful information about pathogenic state. For example, observing the mere presence of human papillomavirus (HPV) DNA is not thought to be as informative as detecting active transcription of viral E6 and E7 genes to mRNA in assessing the likelihood of progression to cervical cancer. Finally, genome wide expression profiling—the capture as it were of a snapshot of the expression levels of all active genes through their respective mRNAs present in a sample—is gaining utility in the personalized assessment of disease states such as cancer, whether performed through next generation sequencing (NGS), RNA-based exome sequencing, or array-based methods of analysis.
Confronting RNA instability
While examples such as these provide evidence for the utility of RNA-based MDx, the practical application of these approaches is less straightforward than the examination of DNA molecules. A major reason for this is that RNA is intrinsically much less chemically stable than DNA. This instability has biological utility inasmuch as the relatively short life of RNA transcripts in a cell gives the cell greater ability to respond to its environment. That is, a transcript upregulated as response to a particular stimulus does not persist forever, meaning the cell’s response and subsequent allocation of cellular resources only lasts as long as the stimulus, plus a short duration thereafter until the associated mRNA(s) decay. This dynamic nature in mRNA levels in response to cellular conditions is precisely why genome-wide expression profiling can provide critical information as to the activation status of myriad biochemical pathways in the sample examined.
As the saying goes, however, “Garbage In, Garbage Out”—and if the sample being examined has had significant RNA degradation, the results of any of these tests will be erroneous. For simple RT-PCR single target assays, the main impact would be on limits of detection with subsequent false negative calls; for genome-wide expression tests, there is also significant waste of laboratory resources both in terms of reagents cost and sample processing time if it is performed on a sample doomed to yield meaningless results. It is in this genome-wide expression profiling context that we will focus the rest of our consideration.
It is, of course, possible to assess from the final experimental results whether the input sample integrity combined with downstream processing steps has led to a valid result. This is the function of various forms of experimental controls, which can take the form of exogenously added templates (which primarily validate the sample handling processes) as well as selected intrinsic RNA markers (which validate both sample integrity and process; by removal of the process component through comparison to the exogenous targets, sample integrity issues can be selectively evaluated). These critical controls ensure that the laboratorian has evidence supporting the validity of a particular test result; however, they can do nothing toward avoiding the waste of resources resulting from processing a degraded sample. What’s needed, then, is a uniform, reliable method of assessing RNA quality in a sample prior to spending time and effort on it.
Assessing RNA quality
Conveniently, there are two RNA species which are ubiquitous across eukaryotic species such as ourselves. They are physically rather large as RNAs go but clearly distinct from each other, making them resolvable by simple electrophoretic methods, and they are of very high abundance, so they make obviously distinct bands, or collections of RNA molecules of a single size, when total cellular RNA is electrophoretically size-separated. Furthermore, their integrity is a representative marker for the integrity of all other RNA molecules in the sample. I refer to the 28S and 18S ribosomal RNAs (rRNAs), which form critical building blocks of the ribosomal assemblies used for protein synthesis.
Long before RNA-based MDx methods had reached clinical laboratories, life science research labs had appreciated the potential of these two molecules to serve as a general marker for the quality of an RNA sample. Initial approaches to employing these markers were simply to run total RNA samples on a simple agarose gel, stain for nucleic acids, and assess by eye whether two distinct bands of sizes expected for the 28S and 18S rRNAs were distinctly visible in the diffuse smear arising from all the other various RNAs. While crude, this method at least allowed for the immediate detection of those samples having undergone significant degradation, as the two bands would either be very faint or not visible at all.
This approach was improved by the use of image analysis methods, with assessment of the relative band intensities of the 28S and 18S markers; a 2.0 or greater ratio of 28S to 18S was taken as evidence of acceptable sample RNA quality. While this approach was a step toward providing a numeric measure which could be compared between samples, differences in exact methodology, manual selection of band areas, and other factors contributed to make it poorly reproducible between laboratories. What was needed to make this a robust and generally applicable approach was greater standardization in the electrophoretic separation method, and heuristic analysis of what aspects of the signal, aside from just relative peak heights of the 28S and 18S, comprise the most meaningful and reproducible measures of RNA integrity.
Utilizing microfluidic capillary chips
For today’s clinical laboratorian interested in testing RNA samples, those needed improvements were realized in the guise of microfluidic capillary chips and a lengthy study of many RNA samples of various states of decay, as done by Andreas Schroeder and coworkers nearly a decade ago.1 Rather than separating RNA samples on individually cast gels, the approach employed uniformly mass-produced microfluidic chips with similarly mass-produced buffers and uniform operating conditions imposed by the instrument used to run the chips. At its heart the technology remains electrophoretic separation, where the intrinsic charge of an RNA molecule subjects it to a motive force in the presence of a DC electric field, and the molecule size acts as a hydrodynamic impediment to this force; smaller molecules migrate faster, and larger molecules migrate slower.
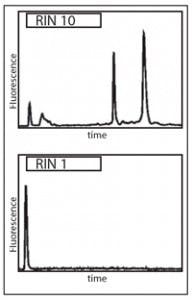
The migration path is along precisely controlled microfluidic channels or capillaries, with detection of passing nucleic acids at one point along the channel by optical means. This detection is dose-responsive, allowing for a monitoring computer to output a trace of time since electric field application to the sample (a surrogate measure of molecule size) versus observed nucleic acid signal. This produces an electropherogram (Figure 1) in which the 28S and 18S molecules provide highly recognizable peaks, which can be automatically analyzed for features including relative ratios of 28S and 18S peak areas to total RNA detected of all sizes; the height of the 28S peak; the ratio of the 28S to 18S peak sizes; and a number of other metrics.
By examining a large number of such metrics for a large collection of samples of different known states of RNA decay, a set of the most informative metrics (and their relative
contributions to a numerical score of RNA integrity) was developed. Together, this approach and these selected metrics can be employed to provide an RNA Integrity Number (RIN) on a eukaryotic RNA extract. Ranging in score from 10 (fully intact RNA) to 1 (completely degraded RNA), the measurement of an RIN is now accepted as an essential first step in any lengthy or costly RNA-based MDx protocol.
Establishing RIN requirements
To make use of these values, a laboratory (or core facility) will establish minimum RIN value requirements as starting material for different classes of experiment; that is, based on experience, the minimum level of RNA integrity that is required to get an acceptably interpretable outcome from an experiment type. You’ll note that I said “core facility,” as for experimental MDx protocols such as NGS exome analysis or whole-genome expression array screening, the infrastructural requirements are often such that a single core facility may meet these needs for multiple smaller clinical MDx laboratories in a region. If this separation occurs between you and a core lab, it’s likely you’ve never really been told the significance of, or methodology behind, this critical RIN value test as a gatekeeper for passing your samples on to the full assay. If that’s the case, hopefully the above will have demystified this somewhat and you’ll now appreciate that when the core lab comes back to you with a poor RIN value and a suggestion you not proceed with the sample, they’re doing you a favor and warning you against throwing good budget money after bad.
Two closing questions and answers on the subject of RINs: first, what should you do if you repeatedly are told your samples have poor RIN values? The most likely issues here relate to method of RNA sample preparation, and the speed with which the patient samples get into RNase-inactivating sample preparation buffers. Review of your sample collection methods with an eye to faster sample introduction to collection buffer, and/or evaluating and selecting better RNA extraction methods as a whole, would be the most likely places to start improvement.
Second, if RINs are so useful, why not employ them as a pre-screening tool for simpler RNA- based assays like simplex RT-PCRs? The answer here is one of economics and time; obtaining an RIN is as costly and time-consuming (or even more so) than just directly performing these simpler assay types. In that context, it makes the most sense to skip the RIN and employ post-assay analysis of controls to assure yourself that suitable quality input material was assayed. For the present, RIN pre-screening makes sense only when the downstream assays are costly enough in terms of reagents, time, and other resources to warrant the up-front added costs.
Reference
- Schroeder A, Mueller O, Stocker S, et al. The RIN: an RNA integrity number for assigning integrity values to RNA measurements. BMC Molecular Biology. 2006. http://www.biomedcentral.com/1471-2199/7/3. Accessed September 23, 2015.
John Brunstein, PhD, is a member of the MLO Editorial Advisory Board. He serves as President and Chief Science Officer for British Columbia-based PathoID, Inc., which provides consulting for development and validation of molecular assays


