Real-world factors create complications during method evaluation studies: What to know and how to address them
Medical laboratory scientists perform method verification to confirm manufacturers’ specifications for new instruments and assays are met prior to actively reporting patient test results for samples. For the most efficient process and to materialize results of greatest value to clinical stakeholders, a number of real-world factors must be carefully considered and assessed.
Method verification evaluations range from simple evaluations, such as when adding a new assay, to complex evaluations involving adoption of new analyzers and methodologies across multiple sites with the intent to standardize a health system. Performance evaluations may also need to be conducted after major maintenance on an analyzer or as an outcome of a root cause investigation to re-establish acceptability of an existing method. Regardless of when these activities are performed, considerable time and resources are invested to understand the analytical performance before initiating or returning an assay or an analyzer to clinical use for patient testing.
During initial evaluations of non-waived methods in the United States, as directed by CLIA, laboratories must conduct studies that assess accuracy, precision, analytic measuring range (AMR), and reference range. These studies confirm the expectations of the manufacturer and the laboratory are met prior to releasing patient results. These activities are essential quality control practices, as evidenced by the many CLSI standards available to detail the specifics of how to accomplish these studies. Even the most efficient studies require multiple days, so planning is essential to capture the data necessary to adequately meet regulatory needs, as well as any additional specific quality policies established by the laboratory director. While installation of new instrumentation is an infrequent occurrence, it typically requires the most extensive preparation and time.
Method comparison studies are the most common testing performed to assess accuracy. They also can be used to verify the AMR. Additionally, method comparison studies can provide valuable information about potential changes in diagnostic decision points or the need for re-baselining patients with new methods.
CLSI EP09c, third edition guidance recommends that method comparison studies include sufficient specimens (defined as at least 40) “…that span the common measuring interval of the measurement procedures.”1 The general rule of thumb for the ideal patient population (n=40) is to have 10 specimens at the low end, 10 specimens at the high end, and 20 specimens in the middle.
Locating such a wide range of specimens can be challenging for laboratories with low test volumes and those that serve primarily healthy populations. The rarity of samples having concentrations with extreme values can mean long lead times for specimen procurement. When specimens are not readily available to balance the distribution across the measuring range, the temptation is to complete the study quickly with specimens from a more narrow and unbalanced range.
Approaches to address these challenges can vary significantly among laboratories. Options include using remnant specimens frozen by the laboratory, sharing patient samples from a neighboring lab network, purchasing Institutional Review Board (IRB)–approved specimens from a vendor, and creating modified (e.g., dilution or spiking) or contrived samples. When moving away from optimal, freshly collected patient specimens and using either storage or sample modification, care is necessary to ensure sample variables are not introduced into the comparison. These variables can delay test availability and redirect staff from their normal duties to troubleshoot unexpected results.
Inaccuracies can stem from degradation, matrix effects, or handling conditions. These differences may mimic bias and/or imprecision, leading to rejection of the performance evaluation data. The ideal method comparison study includes specimens with concentrations distributed across the measuring interval of the method(s). Additionally, the ideal outcome would find that all pairs of measured values lie along the line of identity (method a = method b) of a scatter plot resulting in an intercept of zero and a slope of 1. Rarely do such ideal conditions for method comparison studies exist within the real world—a result of the aforementioned sample procurement challenges combined with methodological differences and imprecision.
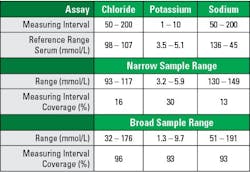
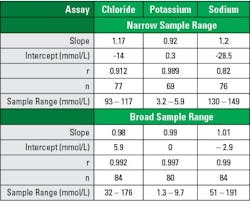
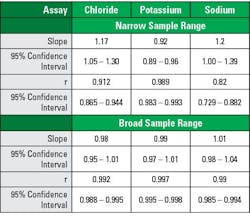
Tables 1–3 illustrate the importance of the proper patient sample balance. These data were taken from recent electrolyte performance verifications with an initial narrow sample range that was supplemented with a broad sample range. Electrolyte assays were chosen because they are tightly controlled biologic analytes with standard reference ranges recognized by most manufacturers. All specimens were unmodified patient samples.
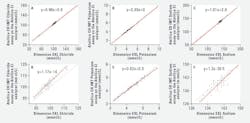
Broad range sampling covered >90% of the AMR, while narrow range sampling covered >30% (See Table 1). Analysis using broad sample ranges demonstrated slope nearer to 1.0, intercept closer to zero, and correlation coefficients closer to 1.0 (See Tables 2–3). The improvement is easily visualized in regression plot comparisons (See Figure 1).
These illustrations demonstrate that while individual sample comparisons may pass the criteria for accuracy, the narrow range method comparison may give an unclear picture of the clinical expectation for overall result interpretation. When considering the data in Figure 1E, one might expect a low bias for potassium levels, but the broad range study (Figure 1B) shows a nearly perfect correlation. These differences in correlation interpretation are even more stark for the sodium evaluation represented in Figures 1F and 1C.
In comparison of regression analysis methods, Stöckl et al similarly looked to electrolytes while examining using regression analysis to access adequacy or agreement in method comparison studies.2 They described the narrow physiological ranges tested resulted in poor estimates of regression statistics, impacting both slope and correlation coefficient, regardless of statistical analysis method.
Similar impacts on regression outputs are seen with narrower sampling ranges and smaller sample numbers, in both cases the impact is a broadening of the confidence intervals for the slope and intercept estimates. Additional visualizations such as bias plots and histograms can help assess whether assumptions about the data are valid and interpret any observed differences in the collected data. For non-standardized assays, concordance tables may provide another layer of understanding with regards to medical decision points. Together, these factors illustrate the critical attention required to have adequately designed studies to assess new instrumentation and methods.
In cases where the methods being compared lack standardization or have different reference ranges, regression analysis may be less desirable. For these assays, it is usually a good idea to put results into a concordance table to ultimately determine the positive, negative, and overall agreement of the two methods. Method comparison is useful for determining potential changes to clinical interpretation. While the methods may not give the same, or even similar, numeric results, the concordance of the interpretation should be the same. This also can be a good indication that re-baselining is necessary for patients who are monitored with a non-standardized assay. For example, oncology markers can be widely variable among manufacturers.
For novel lab tests that may not have a comparator method available, alternatives to method comparison studies include testing for accuracy with samples of known values including calibrators, assayed quality control materials, proficiency materials, or previously assayed patient specimens from another laboratory.4 The AMR verification can be performed with fewer samples of known concentration, or even diluted specimens of known concentration that span the measuring range.
Conclusions
Factors such as components of error and their sources, data collection qualities (e.g., sample number and range), and statistical analysis methods are all important components in interpreting method comparison study results.1-3 Additional information about the statistical underpinnings of regression analysis and goodness of fit, correlation, and sample effects can be found in statistical or analytical textbooks.
With due diligence and careful consideration of these factors, in addition to accuracy and range verification, labs can efficiently and effectively provide clinical information that is effectively interpreted and of greatest value for clinical colleagues. Robust planning is a key component to successful method evaluation study preparation and post-evaluation test implementation success. Review of manufacturers’ Instructions for Use can help to understand differences in the test methods and standardizations that may impact the type of analysis most appropriate.
References
- CLSI. Measurement procedure comparison and bias estimation using patient samples. 3rd ed. CLSI EP09c. Clinical and Laboratory Standards Institute; Wayne, PA: 2018.
- Stöckl D, Dewitte K, Thienpont LM. Validity of linear regression in method comparison studies: is it limited by the statistical model or the quality of the analytical input data? Clin Chem. 1998;44(11):2340-2346. doi:10.1093/clinchem/44.11.2340.
- Linnet K. Performance of Deming regression analysis in case of misspecified analytical error ratio in method comparison studies. Clin Chem. 1998;44(5):1024-1031. doi:10.1093/clinchem/44.5.1024.
- Clinical Laboratory Improvement Amendments (CLIA). Verification of Performance Specifications. April 2006.
About the Author

Melanie Pollan PhD, MT (ASCP)
serves as Senior Director of Medical & Scientific Affairs, Diagnostics, Siemens Healthineers and was a co-author of the ADLM poster presentation A-101 “Is That Unexpected? Education on Handling Real World Complications with Tightly Controlled Analytes During Method Evaluation” with S.A. Love, J. Aguanno, J. Melchior, et al from which this article is derived.


