The most purely patient-based quality control: A novel application of the patient sample as its own control
To take the test online go HERE. For more information, visit the Continuing Education tab.
LEARNING OBJECTIVES
Upon completion of this article, the reader will be able to:
- Discuss the evolution of statistical quality control (SQC).
- List the scientists and describe their early quality control method.
- Describe the advantages to patient-based, real-time quality control (PBRTQC) and which type of testing it would be advantageous for.
- Discuss the study findings of using PBRTQC and its utility in blood gas POC testing.
Since its inception, statistical quality control (SQC) has evolved with laboratory testing. From humble origins of paper charts and hand-plotted data, SQC has changed time and again, in concert with advances in methods, instrumentation, and informatics. Today’s automatic control processes represent the latest, but not the ultimate, form of quality control (QC).
The dawn of SQC was patient-based. When Stanley Levey and Elmer Jennings introduced their control chart (now known as the Levey-Jennings Chart), they were plotting the results, not of commercial controls — which did not yet exist — but instead, those of patient duplicates. Early QC involved repeated patient samples and pooled patient samples, until the economics of commercial controls made them practical and ubiquitous.
QC appears to be coming full circle with the rise of interest in patient-based, real-time quality control (PBRTQC). There is a profusion of recent scientific literature on PBRTQC and its lofty aspirations to replace the use of commercial controls entirely. The International Federation of Clinical Chemistry and Laboratory Medicine (IFCC) has given the approach an official blessing with a formal committee dedicated to its promotion, which has stated that “PBRTQC will become the mainstay of QC in laboratories once the profession sees the advantages of this form of process control, and manufacturers and middleware vendors provide the onboard capability.”1
Perhaps nowhere would this process be more welcome than in point-of-care testing (POCT). While POCT has seen major advances in engineering and performance, it is still notable for high error rates. A recent survey asked point-of-care (POC) clinicians to identify the “practices and wants” most helpful for improving the quality of POCT.2 The most popular request was for more manufacturer-integrated quality and function checks. That is, better QC.
To address the needs of today’s POC users, manufacturers should provide more integrated controls and a more complete system for monitoring all potential failure modes. These capabilities would reduce the need for operator training and supervision of operations. No longer the stuff of fiction, these automatic control systems have been advancing in significant ways. A POC blood gas testing system with enhanced patient-based quality system capabilities has been developed and recently validated by Nichols et al at four different institutions.3 The study used the average detection time (ADT) validation methodology developed by Westgard et al approximately 15 years ago.4 Notably, it found that the ADT for each test is much quicker using newer technologies versus traditional SQC practices. This improved performance has been demonstrated in two additional studies, one by Toffaletti et al (four institutions), and one by Mion et al (two institutions).5,6
The system’s PBRTQC capability incorporates software to monitor the response curves of individual tests, allowing detection of transient errors caused by microclots, microbubbles, or other events that disturb the sensor response during sample data acquisition.
What could be more patient-based than a thorough, individual QC check on each sample?
Personalizing the QC check
An individualized, patient QC check is made possible by a key technological advance in POCT QC systems: monitoring of the measurement-response curve of each patient sample for patient-based analysis. Monitoring of the measurement-response curve directly detects potential problems for each patient sample within each measurement cycle. During the sample-measurement process, the technology collects a series of readings, which are then inspected using pattern recognition software to identify unusual sensor behavior due to transient errors. These errors are defined as events occurring during the sample measurement due to sample preparation and presentation (e.g., microclots, microbubbles, interferences). Such errors are random in nature and may not produce a recognizable signal before or after the sample measurement — making them typically undetectable by traditional QC. Microclots and microbubbles are particular problems for systems that utilize whole blood samples and particularly difficult to monitor via traditional, liquid control methods.7
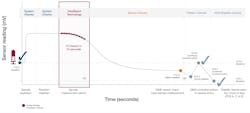
Monitoring of the measurement-response curve is a form of PBRTQC that provides integrated QC for patient samples. One technology that allows monitoring of the measurement response curve is known as IntraSpect. Along with automation of traditional SQC, and extensive system function checks, IntraSpect technology is an excellent example of a manufacturer’s implementation of a PBRTQC technique. Providing real-time monitoring of each patient sample during the measurement cycle, IntraSpect provides additional information about the quality of measurement during the analysis of each patient sample. The process for employing all these checks is illustrated in Figure 1.
Monitoring each patient 15 times
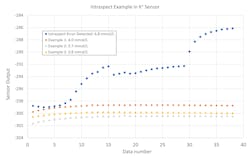
Monitoring of the sensor response by IntraSpect integrates several new steps into the measurement process, providing a higher level of QC performance. IntraSpect records 15 sensor readings (in millivolts) during the last 15 seconds of each patient sample measurement. IntraSpect then analyzes the readings before the result is reported, using pattern recognition analysis, to fit the sample response to a regression model that characterizes the observed sample output and estimates the value of the measurement. This regression model can also identify abnormal sensor responses by comparing the response curve to a compiled library of standard response curves established from the data of normal patient samples. Unusual sensor responses are identified by the shape of the response curve and/or by regression coefficients outside of acceptable limits.Figure 2 illustrates expected and unexpected responses for a potassium sensor. Normal, stable signals are demonstrated by the three lower response curves. In contrast, the top response curve represents a sample where the signal was disturbed by a fluidic blockage during sample aspiration, potentially caused by a blood clot in the sample. The abnormal pattern was detected by IntraSpect, and the sample automatically flagged. It estimated an elevated potassium of 6.8 mmol/L when a value of approximately 4.0 mmol/L was expected, based on a retrospective sample re-analysis run in the same system. Note that for potassium, the regression coefficients representing the slope of the signal are close to zero for normal response curves.
Harnessing data for patient QC
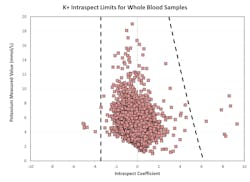
To identify unusual sensor responses from expected sensor response curves, the nature of the response curves for different sensors and analytes must be determined and compiled. To that end, a library of regression coefficients was developed through analysis of response curves for different sensors. The results from thousands of samples from multiple clinical facilities were used to build the library. Where necessary, samples were manipulated to cover the entire reportable range of the system for each measured analyte, as well as several known clinical conditions and common preanalytical errors (e.g., microbubbles, blood clots, interfering substances). This library was then analyzed to determine optimal limits for the regression coefficients for each sensor. These coefficients were tested and optimized using data collected in several clinical locations, during the last steps of system development.Figure 3 shows an example of limits for regression coefficients (slopes) for potassium. Samples with an IntraSpect coefficient value within the dotted lines are acceptable, while those with a coefficient value outside the dotted lines are flagged or suppressed. Most of the coefficient values are close to zero, and the limits show only minor changes with the analyte concentration.
Once control limits are established for the different sensors, the performance is assessed from data collected from millions of samples tested on thousands of systems in clinical use worldwide. Control limits are generally less than half of the Clinical Laboratory Improvement Amendments of 1988 (CLIA) allowable total error for the individual test, and data outside these limits demonstrated that the errors exceeded the CLIA limits.
The results produced through patient-centered QC
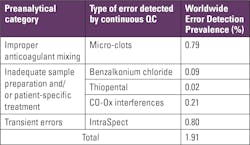
The PBRTQC capabilities discussed above seem to offer important improvements in error detection. Demonstrating that these capabilities actually detect errors is the ultimate proof of this new technology. Table 1 summarizes the categories and prevalence of errors typically detected by IntraSpect. Total preanalytic and transient errors were detected in 1.91% of blood gas testing worldwide. Of the errors observed, approximately half were errors that could only be detected by this new technology (0.80%). These newly observed errors correlated strongly with the detection of microclots caused by improper mixing and/or improper anticoagulant. Interferences due to benzalkonium chloride, thiopental, and optical problems from turbidity were also observed, at a smaller, but significant rate.The truest of real-time QC is now reachable
As laboratories have become faster, more complex, and more automated, the demand for immediate error detection has grown. PBRTQC has been offered as a real-time QC solution — generating control signals far more quickly in response to problems than the traditional once-a-day or once-per-shift QC. The individualized, patient-based technique of IntraSpect provides the truest of real-time QC, scrutinizing the measurement response curve of each patient sample, which greatly exceeds the speed of population statistics, in most PBRTQC applications.
Detection of preanalytical and transient errors, observed in approximately 1.6% of global patient samples, is a critical need. It is estimated that approximately 430 million POC blood gas tests are performed globally, corresponding to 6.88 million patient samples with preanalytic and transient errors.8 Traditional QC approaches will miss the vast majority of these errors, underlining the need for advances in onboard QC. Detection of these preanalytic and transient errors represents a significant improvement in the quality of blood gas testing and demonstrates the utility of the newer technologies. This technology is particularly valuable in the POCT environment, where test results are often used immediately, and real-time error detection for every sample reduces the risk of delay or inappropriate treatment due to transient sampling errors such as microclots, microbubbles, and interfering substances.
For years, laboratory medicine has promised more personalized care. In QC, at least, that promise is now fulfilled.
References
- Badrick T, Bietenbeck A, Katayev A, van Rossum HH, Cervinski MA, Ping Loh T. Patient-based real time QC. Clin Chem. Sep 1 2020;66(9):1140-1145. doi:10.1093/clinchem/hvaa149.
- Westgard SA, Goldschmidt HMJ, Ehrmeyer SS. POCT analysts’ perspective: Practices and wants for improvement. J Appl Lab Med. May 1 2020;5(3):480-493. doi:10.1093/jalm/jfaa037.
- Nichols JH, Cambridge T, Sanchez N, Marshall D. Clinical validation of a novel quality management system for blood gas, electrolytes, metabolites, and CO-oximetry. J Appl Lab Med. Nov 1 2021;6(6):1396-1408. doi:10.1093/jalm/jfab053.
- Westgard JO, Fallon KD, Mansouri S. Validation of iQM active process control technology. Point Care. 2003;2(1):1-7. doi:10.1097/00134384-200303000-00001.
- Toffaletti JG, McDonnell EH, Ramanathan LV, Tolnai J, Templin R, Pompa L. Validation of a quality assessment system for blood gas and electrolyte testing. Clin Chim Acta. Jul 2007;382(1-2):65-70. doi:10.1016/j.cca.2007.03.021.
- Mion MM, Bragato G, Zaninotto M, Alessandroni J, Bernardini S, Plebani M. Analytical performance evaluation of the new GEM® Premier™ 5000 analyzer in comparison to the GEM® Premier™ 4000 and the RapidPoint® 405 systems. Clin Chim Acta. Nov 2018;486:313-319. doi:10.1016/j.cca.2018.08.019.
- D’Orazio P. Effects of blood clots on measurements of pH and blood gases in critical care analyzers. Point Care. 2011;10(4):186-188. doi:10.1097/POC.0b013e318238cb76.
- Westgard JO, Cervera J. Intelligent Quality Management 2 with IntraSpect™ technology for quality control of GEM® Premier™ 5000 blood gas analyzers- A novel application of the patient sample as its own control. Pract Lab Med. May 2022;30:e00273. doi:10.1016/j.plabm.2022.e00273.
