In their groundbreaking 1999 report, “To Err is Human,” Kohn and colleagues estimated that up to 98,000 deaths per year wordlwide could be directly attributed to medical errors.1 This fact, coupled with evidence that 60 percent to 70 percent of all medical decisions are based on laboratory results,2 shows that consistently accurate laboratory outputs are of paramount importance in reducing patient risk.
Laboratories play a pivotal role in patient care, and this role, now more than ever, is increasingly receiving the recognition it deserves. Therefore, laboratories are becoming busier, and with the increase in workloads, it stands to reason that the rate or error will also increase.
It is important to remember that errors are not necessarily restricted to the laboratory itself and that they can occur at any stage throughout laboratory testing. Therefore, it is important to note all potential sources of error, from sample analysis to interpretation of test results, and even at the sample collection stage.
Consequently, it is imperative that laboratories implement a quality management strategy (QMS) that will put measures in place to reduce the risk of error. A major development in improving quality was the implementation of Six Sigma methodologies, originally developed by Motorola in the mid-1980s. These methodologies have recently risen to prominence within the healthcare sector due to their application in laboratory quality control.
Six Sigma (or Sigma Metrics), continues to be applied by laboratories, external quality assurance (EQA) programs, software vendors, and manufacturers, quite simply because it is useful.3 But what exactly is Six Sigma?
Defining Six Sigma
Six Sigma is a method of process improvement which focuses on minimizing variability in process outputs. Variation in lab processes leads to wasted time and resources, in re-running tests and altering standard operating procedures (SOPs), for example. Reducing variation will ultimately reduce costs, improve performance and increase profitability. Sigma is an effort to measure, to quantify, errors, and then to reduce their number as much as possible.
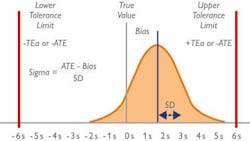
The Sigma model looks at the number of standard deviations (SD) that fit within the quality specifications of a process. In the clinical laboratory, the quality specifications relate to the Total Allowable Error (TEa) for each test. Simply put, the higher the number of SDs that fit within the limits, the higher the Sigma score, and therefore the more robust the process/method. (Figure 1)
In the lab, a Sigma score of three (3) is considered the minimum accepted performance, while a score of six (6) is considered the “gold standard.” This is, unsurprisingly, almost impossible to achieve, but a lab with a Sigma score of 6 will experience approximately 3.4 errors (defects) per one million QC test runs—thereby highlighting the accuracy and reliability of a Six Sigma test.
Calculating Sigma
Within the settings of the clinical laboratory, Sigma is most commonly calculated by measuring variation.3 The imprecision (CV) and inaccuracy (Bias) are routinely calculated for each test, and those metrics can be used in Sigma calculations, in conjunction with the TEa. The TEa for each test can be located from numerous sources; for example, CLIA, RiliBAK and Biological Variation provide TEa limits for each test, and are commonly used by laboratories worldwide.
Sigma is calculated using the following equation: Sigma = (TEa – %Bias) / %CV
- TEa is Total Allowable Error.
- Bias is the deviation (%) between obtained mean and the reference value or peer group target.
- CV is imprecision of the data (%).
As an example, a laboratory is running aldosterone and wants to evaluate whether it is performing close to Six Sigma. The lab checks the CLIA database, which shows that aldosterone has a TEa of 36.7%. The laboratory then calculates the %Bias of their aldosterone assay when compared to its peer group and finds that it is running with a Bias of 5%. The aldosterone assay also has a CV of 10%. Using the calculation outlined above, we see that:
- Sigma = (TEa – %Bias) / %CV
- Sigma = (36.7% – 5%) / 10%
- Sigma = 3.17
In this instance, the aldosterone assay is running just above three Sigma, which is around the minimum acceptable performance. The laboratory will need to make efforts to decrease its %CV and %Bias to improve the overall Sigma Score for the assay.
Benefits of Sigma
By incorporating Sigma calculations into your quality management strategy, your laboratory can reap benefits. One of the main functions of calculating Sigma is to give labs a quantitative indication of the approximate number of failed quality control (QC) results per million tests. In simpler terms, as the Sigma score increases, the approximate number of failed QC results will decrease. Figure 2 highlights the probability test results that will be within acceptable limits in relation to Sigma score.
Table 1 shows the percentage accuracy and approximate number of failed tests per million QC runs. Once labs are able to quantify their approximate number of QC failures, they can identify any poor performing tests and take steps to improve their performance.
The benefits of a more dynamic QC strategy include reduced cost and time implications in the long-run, as well as greater levels of error detection, thereby drastically reducing risk to the patient. In the 2018 paper “Analytical Sigma metrics: A review of Six Sigma implementation tools for medical laboratories,” Westgard concludes that through the assessment of Sigma metrics laboratories can specify the number of control rules, the number of control materials, and even the necessary frequency of running those controls. Sigma metrics are providing a gateway to designing a customized, optimized QC strategy for the method.4
Where should you start?
Implementing Six Sigma methodologies, along with root cause analysis (RCA) and ongoing quality improvement evaluations, is an exhaustive (and exhausting!) process. For this reason, it may not be time-efficient to implement Six Sigma practices for all tests in the lab right away. It would be better to identify a few tests which you know are performing poorly and carry out the following steps:
- Calculate %Bias, %CV and TEa for selected test(s).
- Carry out the calculation Sigma = (TEa – %Bias) / %CV to determine Sigma scores for each test.
- Make efforts to identify the potential sources of error which could be negatively influencing the accuracy and precision of your test(s).
- Once improvements have been made to your quality system, recalculate Sigma using your new imprecision and inaccuracy values.
- Monitor Sigma performance over time, which should be improving as a direct result of improved quality practices.
The reward of vigilance
Clinical laboratories are rapidly evolving, and in such a dynamic marketplace, the old “one size fits all” model of quality management is not sufficient to meet the time and cost-saving requirements of the new modern laboratory. Innovative solutions are needed, along with a constantly vigilant approach to QMS optimization.
Sources of error can permeate every facet of the laboratory. However, Six Sigma is an effective and proven way of identifying goals, using metrics to establish current performance, critically evaluating all processes, identifying and implementing potential solutions, and evaluating results. The laboratory’s entire testing process can be quantified using Sigma metrics, and steps can be taken to implement continuous process improvement.
Every lab, no matter how big or small, should be invested in the quality of its processes and, therefore, the quality of its results.
REFERENCES
- Kohn LT, Corrigan JM, Donaldson MS. To Err Is Human: Building A Safer Health System. 1999: Washington, DC: National Academy Press, Institute of Medicine.
- Forsman RW. Why is the laboratory an afterthought for managed care organizations? Clin Chem. 1996;42(5):813-816.
- Westgard, S. Six Sigma Metric analysis for analytical testing processes. 2016.
- Westgard SA, Westgard JO, Bayat H. Analytical Sigma metrics: A review of Six Sigma implementation tools for medical laboratories. Biochemia Medica. 2018;28(2):020502.


